 Junior IAS Academy
Geography
Map Reading for Students: Directions, Scale and Coordinates Explained with Simple Activities
A map becomes useful when you can explain what it shows, work out where you are and judge how far you need to travel. Start with the title, legend, direction and scale. Then use landmarks or coordinates to locate a place. These small checks turn a page of shapes into information you can use.
Picture a school excursion. One student points to a museum and says, “It is just here.” Another asks, “Which entrance? How far from the bus stop? Is that line a road or a railway?” The second student is already thinking like a map reader.
This guide is for students in Classes 6–10 and the parents and teachers who support them. You do not need expensive equipment: a pencil, ruler, notebook and suitable printed map are enough. The aim is to understand places, rather than memorise a page of labels.
Start by asking what the map is for
Before looking for your destination, read the title. A rainfall map, a railway diagram and a street map may cover the same area while answering very different questions. A map showing state boundaries will not necessarily tell you which road to take. A transport diagram may simplify distances so that connections are easier to see.
Ask three questions: What area does this cover? What information does it emphasise? What information does it leave out? Look for a date or edition too. An old road map can still teach direction, but it may not show a recently opened bridge.
Try this at home. Find two maps of the same city. Write one question each map can answer well. Then write a question neither can answer. This is a useful reminder that a map is a carefully selected representation, not the place itself.
A useful map question is: “What does this help me understand—and what must I check elsewhere?”
This is an editorial learning prompt, not a quotation attributed to a public figure.
Read the legend before interpreting the symbols
The legend, sometimes called a key, explains what symbols, colours and lines mean. A blue shape may represent water on one map; on a statistical map, blue could represent a population category. Never assume that a colour has the same meaning everywhere.
For a practice activity, draw a fictional park. Choose symbols for a gate, toilet, drinking-water point, pond and path. Add a legend. Give the sheet to someone who has not watched you draw it. Can they find the toilet without asking you?
If they cannot, revise the symbol or explanation. The purpose is communication. A beautiful drawing that leaves its reader guessing needs more work.
Keep symbols large enough to distinguish and avoid relying on colour alone. Different shapes or line styles help when a map is printed in black and white, or when a reader finds some colours difficult to distinguish.
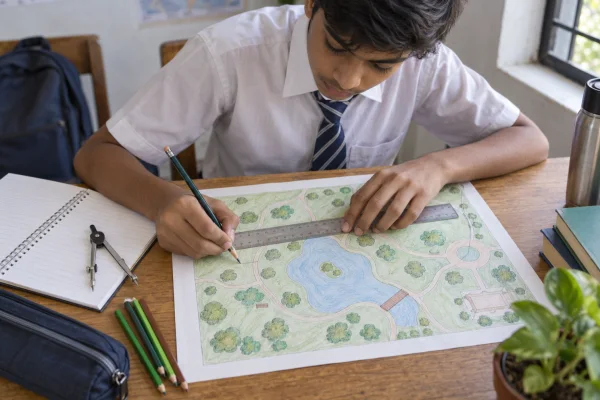
Conceptual illustration: practising with a fictional map. The pictured drawing is not a navigational map or a scale-measurement exercise.
Directions belong to the map, not to your body
North, south, east and west are the four cardinal directions. Read the north arrow or orientation information before deciding that the top of a page is north. Many maps use north at the top, but not all do. A phone map may rotate as its user moves.
Put a north arrow on your fictional park map. If the pond is east of the gate, turning your paper does not change that geographic relationship. Your own left and right change when you turn; the map’s directions stay tied to its orientation.
Now practise giving an instruction with a starting point: “From the gate, the pond lies northeast.” Compare it with “The pond is over there.” The first statement gives another person enough information to begin checking the claim.
For younger learners, use four directions first. Add northeast, southeast, southwest and northwest when those relationships feel comfortable. Precision develops through practice, not by introducing every term at once.
Scale: turn a paper distance into a real distance
Scale describes the relationship between a distance on the map and the corresponding ground distance. It may appear as a written statement, a ratio or a graphic scale bar. Always keep the units consistent.
Here is a worked example using an imaginary map. Its scale says 1 centimetre represents 200 metres. Two points are 3.5 centimetres apart on the sheet. Multiply 3.5 by 200: the straight-line ground distance is 700 metres.
A ratio of 1:10,000 means one unit on the map represents 10,000 of the same units on the ground. One centimetre therefore represents 10,000 centimetres, or 100 metres. The ratio does not mean one centimetre represents 10,000 kilometres.
Make a habit of writing the unit beside every calculation. A correct number with the wrong unit can describe a completely different journey.
A “large-scale” map generally shows a smaller area in more detail than a “small-scale” map. Think about the fractions: 1/10,000 is larger than 1/1,000,000. The language is easier to remember when it is linked to the amount of detail you can see.
Straight-line distance is not always route distance
A ruler can measure the direct line between two points. A traveller may need to follow a winding road, cross at a bridge or enter through a particular gate. The actual route can therefore be longer.
On your park drawing, create a pond between the entrance and a reading area. Draw a path around it. Measure the direct line first. Then follow the path using several short ruler measurements or a piece of string laid along the route. Compare the results using the same scale.
This activity also teaches a limit of maps: the shortest route is not automatically the safest or most accessible. A map may not describe traffic, a closed gate, steps or temporary construction. Students should explore real locations with appropriate adult supervision and follow local access rules.
Coordinates: give a place an address on a grid
A classroom grid is a friendly introduction to location. Label columns A, B, C and D, and rows 1, 2, 3 and 4. Put the library in B3 and the pond in D2. Agree that the letter comes first. Someone else can now locate each feature without a long description.
That simple classroom code is not a universal geographic coordinate system. Real maps may use a national grid, latitude and longitude, or another clearly specified system. Read the map’s instructions before transferring a reference from one map to another.
Latitude describes position north or south of the equator; longitude describes position east or west of the prime meridian. They are angular measurements expressed in degrees. A pair needs its directions or signs and a clear order to be meaningful.
When copying coordinates from a trusted atlas or map, keep the labels. Do not casually swap latitude and longitude. For practice, use public landmarks rather than a student’s home address, and avoid posting children’s personal locations online.

Conceptual globe illustration. Use a labelled atlas or classroom globe for exact coordinate work.
Use height information to imagine the landscape
Some maps show contour lines: lines joining places at the same elevation. Read the contour interval, which tells you the height difference between adjacent contour lines. On a map with a consistent interval, closely spaced contours generally indicate a steeper slope than widely spaced contours.
A classroom model can make this easier to picture. Stack several pieces of cardboard, each smaller than the one below, to make a hill. View it from above. The edges resemble contours. View it from the side and notice how the stacked levels represent height.
Do not use an unlabelled decorative illustration to estimate a real slope. The scale, contour interval and source matter. The model teaches the idea; a properly prepared map supplies the measurement.
Classroom case study: two routes to the same destination
The following is a hypothetical teaching example, not a reported Junior IAS Academy student result.
A teacher gives a group a fictional campus map. The library lies 400 metres from the entrance in a straight line. Route A follows a 600-metre path with steps. Route B follows an 800-metre path marked as step-free. The group must explain which information a visitor would need before choosing.
At first, one student chooses Route A because it is shorter. Another notices the steps. A third asks whether the step-free route is open. The teacher asks them to separate what the map states from what still needs checking.
Their final answer names both distances, mentions the steps and says that current access conditions must be confirmed. No one needs to “win” the discussion. The successful outcome is a recommendation that explains its evidence and its limits.
You can adapt this exercise for Chennai or any other city using a fictional layout. Keep real road-crossing decisions out of unsupervised practice. The learning comes from comparing information, not from sending children to navigate unfamiliar streets alone.
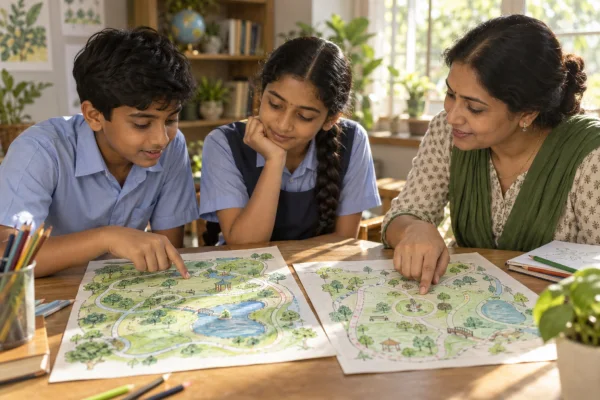
Illustrative learning scene; not a photograph of an actual academy session or a documented student outcome.
A short practice routine for the week
Session one: decode. Choose a suitable map and explain its title, legend, orientation and scale to a partner. Let the partner ask one question you have not considered.
Session two: measure. Calculate one straight-line distance and one route distance. Show the arithmetic and units. If the numbers look surprising, check the measurement before changing the answer.
Session three: communicate. Draw a fictional place and write instructions that another learner can follow. Ask them to mark where they think the destination is. Improve the map after seeing their interpretation.
Parents can support the activity without turning it into another test. Ask, “How did you work that out?” Give time for an explanation. If a learner prefers speaking, pointing or a larger printout, adapt the task. Understanding can be demonstrated in more than one way.
Common questions about map reading
Can I measure a distance from a screenshot?
Be careful. A numerical scale printed for an original page may no longer match a resized screenshot. A graphic scale bar that has resized consistently with the map can help, provided the image has not been stretched unevenly. For dependable practice, use a map with a known scale and print settings.
Does a map show everything that exists?
No. The maker selects information for a purpose. Small features may be omitted or represented by symbols larger than their true ground size. Read the legend and avoid treating every symbol’s printed width as a physical measurement.
Is a digital map enough?
Digital maps are useful, but understanding direction, symbols and scale helps you interpret their suggestions. Check the selected travel mode and current local conditions. A route suitable for a vehicle may be inappropriate for a person walking.
How do students know they are improving?
Ask them to explain a location, calculate a distance with units and name one limitation of the map. Those demonstrations reveal more than simply recognising a term in a multiple-choice question.
A small skill with a wide reach
Map reading connects geography with mathematics, observation and careful communication. A student who can explain a route is practising measurement. A student who notices a missing legend is evaluating information. A student who asks whether a route is accessible is considering another person’s needs.
At Junior IAS Academy, this is a useful educational conversation to begin: choose one map, ask a thoughtful question and support the learner in explaining the answer. Families can learn more about the academy at www.joinjuniorias.com. Keep the first step small enough that curiosity has room to grow.
Sources and further learning
Core concepts can be explored in NCERT’s geography materials through the official textbook portal, including lessons on maps and globe coordinates. For practical map-reading exercises, see Ordnance Survey’s Map Reading Made Easy. Its national-grid examples are UK-specific; do not apply those grid references automatically to Indian maps. Classroom activities and the fictional case above are original teaching examples.
- JUST AN OPPORTUNITY TO UNDERSTAND OUR OWN CITIZENSHIP LAWS! 🇮🇳
- How Students Can Disagree Without Arguing
- How to Read Charts and Percentages: A Data-Literacy Guide for School Students