 Junior IAS Academy
Data literacy
How to Read Charts and Percentages: A Data-Literacy Guide for School Students
Start with the question, not the tallest bar
A student sees a colourful chart and immediately announces the winner. Another student pauses: What is being counted? Over what period? Out of how many people? That second response is the habit worth practising. Reading charts well means understanding both the numbers and the story those numbers can reasonably support.
Data literacy for school students starts with a few manageable skills: reading labels, checking scales, comparing like with like and describing uncertainty. You do not need a complex spreadsheet to begin. A notebook, a small set of numbers and a willingness to ask questions are enough. This guide uses invented classroom examples throughout, not results from an actual school or academy.
Parents can use the activities at home, and students can try them with a teacher. Keep the discussion curious rather than competitive. The aim is to explain an answer clearly, including what the evidence does not tell us.
Key takeaways
Read the title, units, dates and source before comparing values. Ask “out of how many?” when you see a percentage. Distinguish percentage points from relative percentage change. Describe who answered a survey, and separate the pattern you observe from the explanation you would like to test.
1. Read the whole chart before interpreting it
Give every chart a short first inspection. Read its title, both axes, the unit, the dates and the source. Then look for a note explaining who or what was included. A graph labelled “Library use” could show books borrowed, people visiting, or hours spent inside. Those are different measurements and cannot be substituted for one another.
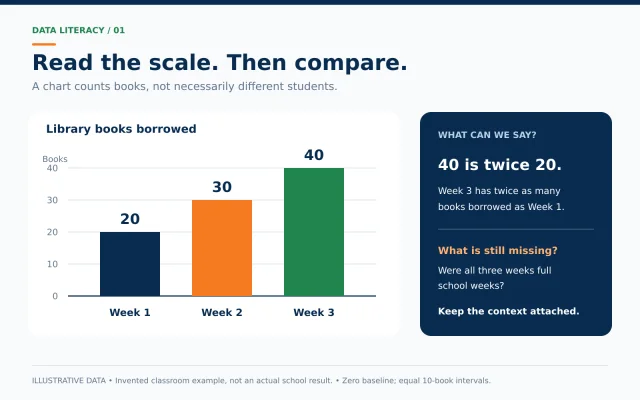
Imagine three weekly borrowing totals: 20 books in Week 1, 30 in Week 2 and 40 in Week 3. We can say that the recorded total increased each week. We cannot say that 40 different students borrowed books in Week 3. One person could have borrowed several books. A useful student answer would name the measure directly: “Forty books were borrowed,” rather than “Forty students used the library.”
Now ask about the time period. Were all three weeks full school weeks? If one included a holiday, that difference may matter. You do not have to reject the chart. You simply need to keep its context attached to your conclusion.
2. Read the axes, not just the visual impression
A bar chart communicates quantities through bar length. The Office for National Statistics recommends a zero starting point for bar-chart value axes. Without it, a modest difference can look much larger. When reading a chart, follow the numbered scale rather than judging the picture alone.
Try this with our illustrative library totals. On a scale from zero to 40, the final bar is twice as long as the first because 40 is twice 20. If somebody crops away the bottom of the chart, the visible bars can suggest a very different relationship. The printed values have not changed, but the visual impression has.
Check the gaps between tick marks too. A scale marked 0, 10, 20 and 30 uses equal steps. An unlabeled jump or a change of units needs attention. For line charts, a non-zero axis can sometimes be appropriate, so do not apply a blanket rule that every shortened scale is wrong. Read the actual values and the purpose of the chart.
3. Ask “out of how many?” whenever you see a percentage
Percent means out of one hundred. To find a percentage, divide the part by the total and multiply by 100. If 12 of 30 students choose a reading club, the share is 40%. If 12 of 60 choose it, the share is 20%. The same count tells a different story when the group size changes.
Here is another invented comparison. Class A has 30 students and 15 choose badminton. Class B has 40 students and 16 choose badminton. Class B has more badminton choices by count, but Class A has the higher share: 50% compared with 40%. Neither statement contradicts the other. Each answers a different question.
When someone says a result is “higher,” ask whether they mean a larger number or a larger proportion. Then write the comparison in full. “Class B has one more badminton choice” is precise. “Class B likes badminton more” is too broad for this small exercise.
4. Separate percent change from percentage-point change
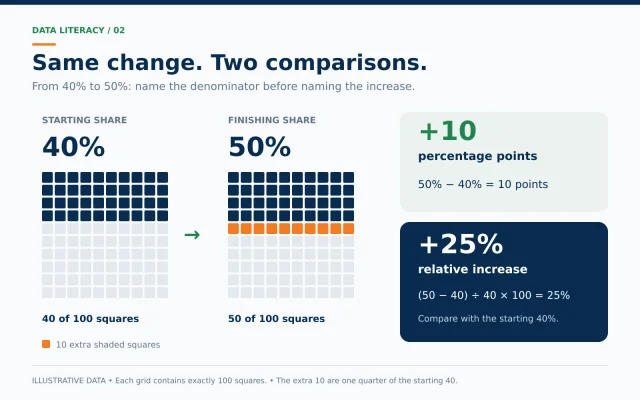
Suppose the share choosing a reading club rises from 40% to 50%. The difference is 10 percentage points. The relative percentage increase is 25%, because the increase of 10 is one quarter of the starting value of 40. These are two ways of describing the same change, with different denominators.
A hundred-square grid makes the distinction visible. Shade 40 squares in the first grid and 50 in the second. There are ten extra shaded squares out of the full hundred. Compared with the original forty shaded squares, those ten extra squares represent a quarter more. Always state which comparison you are making.
For a school exercise, write three separate lines: starting share 40%; finishing share 50%; change 10 percentage points, equivalent to a 25% relative increase. There is no need to rush the calculation. Naming the starting value is often the step that prevents confusion.
5. Match the chart to the question
Bar charts are useful for comparing categories, such as the number of votes for different clubs. Line charts can help show change over time. Pie charts show parts of one whole, so the categories must fit that purpose. The ONS advises against pie charts for questions where respondents may select several answers, because the total can exceed 100%.
Imagine asking students which activities they enjoy and allowing three selections each. Reading, football and music are no longer separate slices of one exclusive choice. A bar chart showing the number selecting each activity would be easier to interpret. Include a note that multiple answers were allowed.
Before drawing, finish this sentence: “I want the reader to compare…” If you cannot finish it clearly, return to the question. Decorative colours and three-dimensional effects cannot repair an unclear comparison. A simple chart with honest labels is a better starting point.
6. Look for the missing people and missing answers
A survey of your friends tells you about the people who answered it. It does not automatically describe your whole school. If you ask only members of a football club which sport they enjoy, football will probably be well represented. That is a reason to describe the group accurately, not a reason to hide the result.
Write down how many people were invited and how many replied. If 20 classmates are invited and 12 reply, the eight missing responses may matter. Avoid silently treating them as votes against every option. “Six of twelve respondents chose music” is different from “Half the class chose music.”
The same care applies to online polls. A large response count does not, by itself, prove that the group represents everybody. Ask who could participate, who chose to respond and whether the question encouraged a particular answer. These questions help you decide how far a conclusion can travel.
7. Describe a pattern without inventing a cause
In our imaginary library, borrowing rises during the same month that a reading poster appears. It is tempting to credit the poster. But the school might also have acquired new books, introduced a reading period or changed its borrowing rules. The chart alone cannot separate those explanations.
A careful sentence would be: “Borrowing increased during the period when the poster was displayed.” A stronger claim, such as “The poster caused borrowing to double,” requires more evidence. This is a useful distinction for school projects, advertisements and everyday conversations about results.
Try dividing a page into two columns: “What the data show” and “Possible explanations to investigate.” Put the numerical pattern in the first and your ideas in the second. That small separation keeps an interesting hypothesis from becoming an unsupported fact.
8. Try a small survey with a clear boundary
Choose a low-stakes question, such as which of three fictional story settings a small group prefers. Explain that participation is optional. Avoid collecting names, phone numbers, marks, family income or health information. You need only anonymous counts for this exercise. Ask a parent or teacher before involving classmates or sharing results.
Keep the question neutral and the response choices clear. Allow one answer if you want categories that add up to one total. Record the date, group size and exact question. Count the responses, check the sum and make a simple bar chart with a zero baseline. This is an original practice activity, not an academy assessment.
NCERT’s Grade 8 mathematics bridge programme includes collecting data and representing it through tables and charts. Your own exercise can follow that practical spirit without becoming a large research project. End with two accurate observations and one limitation.
Quick questions students often ask
Does a bigger sample always give a better answer? More responses can be useful, but the way people are selected still matters. Asking more members of the same sports club does not turn the result into a survey of the whole town. Describe the selection method as carefully as the size.
Can a chart be accurate but incomplete? Yes. The plotted numbers may be correct while the title leaves out the date, the source is missing or the chosen period excludes an important earlier change. Look for the fuller explanation before deciding what the picture means.
What should I do if two charts disagree? First compare their definitions, dates, locations and units. One may show totals and the other percentages. One may cover a school term and the other a calendar year. Only after checking those details can you tell whether there is a genuine disagreement.
Do I need to calculate everything mentally? No. Use paper or a calculator, then check whether the result makes sense. An estimate is helpful: if 15 of 30 students select an option, the answer should be half, so 50% is reasonable.
9. Use a five-question checking routine
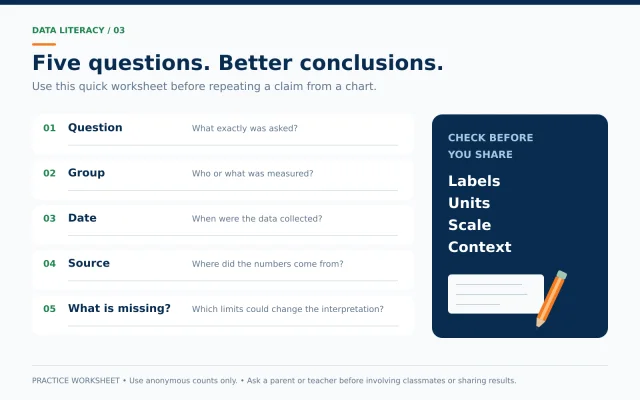
Before repeating a claim from a chart, ask: What question was asked? Which group was measured? When were the data collected? Where did the numbers come from? What information is missing? Write these five prompts on a page and reuse them. They are especially helpful when a screenshot has lost its caption or source.
Parents can model the same habit without turning dinner into an examination. Pick one chart, ask one question and listen to the explanation. If a calculation is wrong, return to the numbers together. If the conclusion is too broad, ask what smaller statement the evidence supports. You can praise careful reasoning without pretending every answer is correct.
The next time a bold percentage catches your eye, pause before agreeing or disagreeing. Find the whole behind the percentage, read the scale and name the limits. These small habits make a student’s explanations clearer and make numerical claims easier to discuss fairly.
Save the five-question routine and try it with one chart this week. Which label or missing detail changed your first impression?
Sources and further reading
- ONS: Bar chart guidance
- ONS: Axes and gridlines
- ONS: Pie and doughnut charts
- NCERT: Grade 8 Mathematics Bridge Programme
- JUST AN OPPORTUNITY TO UNDERSTAND OUR OWN CITIZENSHIP LAWS! 🇮🇳
- How Students Can Disagree Without Arguing
- Map Reading for Students: Directions, Scale and Coordinates Explained with Simple Activities